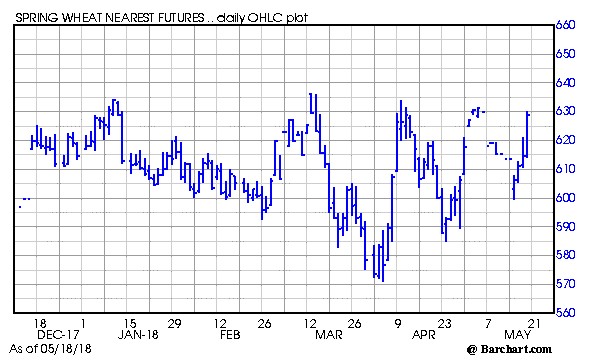
101, since about the beginning of April what does the wheat chart indicate when there are lower highs and higher lows. I wonder if it could blow by the recent $6.40 highs if North American hard wheat growing areas remain dry and how long would it take? Will fundamentals rule the day or will the market be played by funds, specs and chart dynamics
Announcement
Collapse
No announcement yet.
Mgex wheat
Collapse
Logging in...
Welcome to Agriville! You need to login to post messages in the Agriville chat forums. Please login below.
X
-
Tags: None
-
Pennant formation. It is an upside down pennant. Usually when there is an established downtrend, the downtrend will continue.
If a guy had to choose I would say it is likely that there is a bit more downside to go. If the bars are going to stay within the pennant, tomorrow has to be a green day.
There is also a weak downtrend marked by a "fork" that prices seem to be tracking right now. It will take into June with no widespread precip. before the trade will start bidding it up. Same as last year.
Kansas market could contribute. Latest crop condition report shows no change. 36% poor or very poorLast edited by farming101; May 14, 2018, 23:26.
Comment
-
Australia may well be in trouble in 3 weeks time.
But dont get backyarditis eu good russia good black sea becoming good
Prices did kick here again export wise buyer have $290 port on offer up 6 from previous day.
basis strong here
Comment
-
MWN up yesterday and again this morning. the present price of 610.25 puts it right on the median line of the fork pattern mentioned above. A good place to finish today. See if it holds
Comment
-
- Reply to this Thread
- Return to Topic List


Comment