• You will need to login or register before you can post a message. If you already have an Agriville account login by clicking the login icon on the top right corner of the page. If you are a new user you will need to Register.

Announcement

Collapse
No announcement yet.

Crop Yields

Collapse
X
Collapse
 
  • Filter
  • Time
  • Show
Clear All
new posts

    #41
    Originally posted by SASKFARMER3 View Post
    Really grass I called last years crop not the huge as what they thought and this year I called 2018 way lower. But as our neighbourhood troll what have you done that actually adds to anything.

    Nothing your a useless fool.
    I guess you make so many predictions odds would indicate *you're* bound to get one right. From the January 12th prediction that the year's crop will be a disaster, to the March one that it'll be a flood situation, to the July one that it's time to stick a fork in as your crop is "done" due to drought to pulling off very good yields that you can boast about all winter. And that's only the reporting on your own farm.
    I can see why they never gave you the crop reporting job in your Government career - you know before you became a full-time, part-time farmer?
    Comment


      #42
      I finally figured you out your jealous.

      Comment


        #43
        You two need to relax and chill already. Lol!

        Comment


          #44
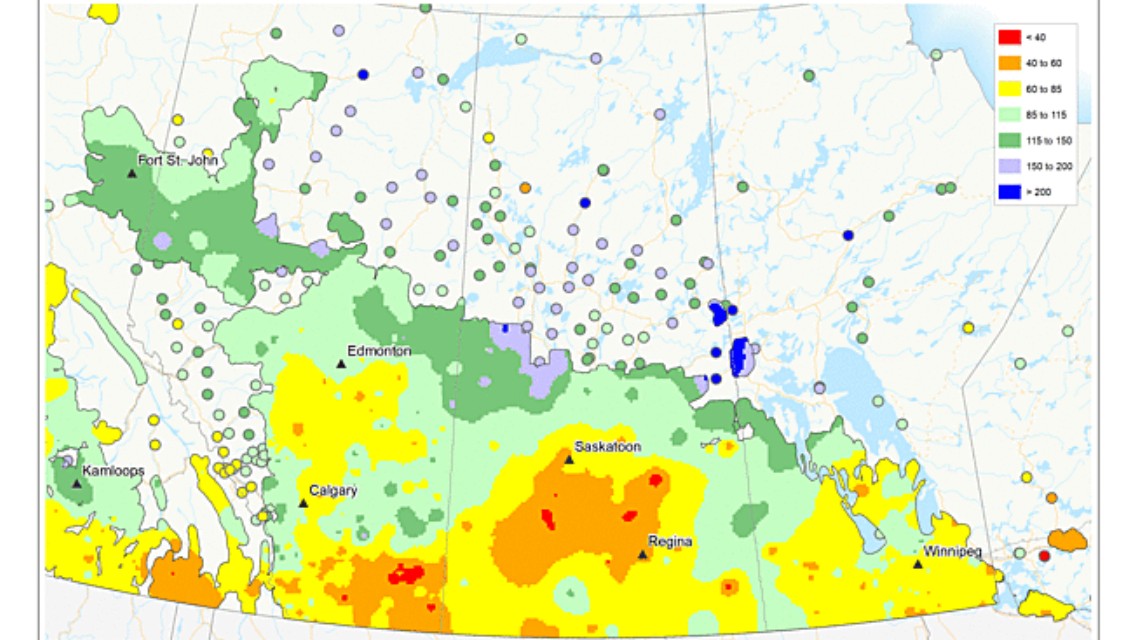
          This map will indicate yields
          Past 60 days rainfall percentage of average on top of low sub soil reserves...


          Really can’t argue about it ... period .

          Comment


            #45
            Originally posted by SASKFARMER3 View Post
            Really grass I called last years crop not the huge as what they thought and this year I called 2018 way lower. But as our neighbourhood troll what have you done that actually adds to anything.

            Nothing your a useless fool.
            It’s likely best to use the ignore feature for this permanent troll......his goal is to cause disruption or derailment of any topic.

            Comment


              #46
              Originally posted by furrowtickler View Post
              This map will indicate yields
              Past 60 days rainfall percentage of average on top of low sub soil reserves...


              Really can’t argue about it ... period .
              And please correct me if I am wrong, but don't the worst affected areas also correlate with the typically most productive areas?

              Comment


                #47
                See that green dot east of Regina...thats the Ghetto! Or damn close to it.

                Lines and boundaries are arbitrary.

                Comment


                  #48
                  Originally posted by farmaholic View Post
                  See that green dot east of Regina...thats the Ghetto! Or damn close to it.

                  Lines and boundaries are arbitrary.
                  See the brown dot between Edmonton and Calgary and a bit west? That is the new slum of the ghetto, formerly known as the rain forest where we farm.

                  Comment


                    #49
                    That map sums up the crop to a T.

                    Yes we’re lime green.

                    Alberta the corridor is the most productive in Alberta.

                    Sask that brown area grows lots of grain.

                    Yea it’s no bumper.

                    Comment


                      #50
                      I am in that yellow dot between Stoon and Lloyd
                      One area of high moisture not showing is a line from Cutknife through Maidstone Lashburn to Paradise Hill

                      Comment

                      • Reply to this Thread
                      • Return to Topic List
                      Working...