• You will need to login or register before you can post a message. If you already have an Agriville account login by clicking the login icon on the top right corner of the page. If you are a new user you will need to Register.

Announcement

Collapse
No announcement yet.

Answers from AESO regarding Alberta power generation

Collapse
X
Collapse
 
  • Filter
  • Time
  • Show
Clear All
new posts

    Answers from AESO regarding Alberta power generation

    In a thread a couple weeks ago during the cold spell while Alberta's power generation was maxed out, and we were discussing the contribution of wind and solar, it was suggested that we just didn't know how to read the supply/demand report posted by AESO, so I called to clarify our concerns. Had all but forgotten until today when they returned the call, with many apologies for taking so long, understandable given the weather conditions at the time.
    The supply and demand report in question: http://ets.aeso.ca/ets_web/ip/Market/Reports/CSDReportServlet http://ets.aeso.ca/ets_web/ip/Market/Reports/CSDReportServlet

    Here is what I learned, or confirmed:
    There is nothing nefarious or secret about the report, what we can read online is exactly what is going into and out of the grid at that time. Even a dumb farmer can understand it.

    Zero output really is zero output, it all balances out, if a plant shows zero output it is for one of these reasons:
    1. 1)Scheduled maintenance, which has to be scheduled 2 years in advance
    2. 2)Unscheduled breakdowns, especially due to weather
    3. 3)Bidding too high, relative to the competition, placing that generation lower on the stack, while cheaper sources get priority until/if demand reaches the point where it is required


    Wind power really was virtually zero for the entirety of the cold spell, due to the wind not blowing.

    Solar plants have to shut down below a certain temperature. Unconfirmed as being -25C, not sure if this applies to the existing Brooks plant too, or only the new plant(s) about to come online. This was news to me, and is contrary to my previous understanding, that they are most efficient at cold temperatures. Might require some more research. During the cold (with clear skies) weather, Brooks mostly read zero, but occasionally showed 1 out of 15 MW. Yet as soon as the weather warmed up, it read 6 out of 15 in mid to late morning.

    Awaiting an answer as to whether any wind farms have a minimum temperature they can be operated in.

    Contrary to Grassfarmer's explanation, the pool price is exactly what it sounds like. The sum of all the bids that are being called for at that time, divided by the total supply, and all generators get that same pooled price for that period of time. Regardless if they bid $0 or $999.99 they get paid the same. So I suppose you could call it collusion, when if you know that demand is at critical levels, you can bid the maximum amount, knowing everyone else will do the same(after all, the supply and demand is available for all to see on their public website). Under any other circumstance, it pays to bid low enough to not end up at the bottom of the stack, not producing anything.

    There are some broken links to historical generation reports on their website, they are looking into it.
    Last edited by AlbertaFarmer5; Jan 29, 2020, 00:38.

    #2
    Originally posted by AlbertaFarmer5 View Post
    In a thread a couple weeks ago during the cold spell while Alberta's power generation was maxed out, and we were discussing the contribution of wind and solar, it was suggested that we just didn't know how to read the supply/demand report posted by AESO, so I called to clarify our concerns. Had all but forgotten until today when they returned the call, with many apologies for taking so long, understandable given the weather conditions at the time.
    The supply and demand report in question: http://ets.aeso.ca/ets_web/ip/Market/Reports/CSDReportServlet http://ets.aeso.ca/ets_web/ip/Market/Reports/CSDReportServlet

    Here is what I learned, or confirmed:
    There is nothing nefarious or secret about the report, what we can read online is exactly what is going into and out of the grid at that time. Even a dumb farmer can understand it.

    Zero output really is zero output, it all balances out, if a plant shows zero output it is for one of these reasons:
    1. 1)Scheduled maintenance, which has to be scheduled 2 years in advance
    2. 2)Unscheduled breakdowns, especially due to weather
    3. 3)Bidding too high, relative to the competition, placing that generation lower on the stack, while cheaper sources get priority until/if demand reaches the point where it is required


    Wind power really was virtually zero for the entirety of the cold spell, due to the wind not blowing.

    Solar plants have to shut down below a certain temperature. Unconfirmed as being -25C, not sure if this applies to the existing Brooks plant too, or only the new plant(s) about to come online. This was news to me, and is contrary to my previous understanding, that they are most efficient at cold temperatures. Might require some more research. During the cold (with clear skies) weather, Brooks mostly read zero, but occasionally showed 1 out of 15 MW. Yet as soon as the weather warmed up, it read 6 out of 15 in mid to late morning.

    Awaiting an answer as to whether any wind farms have a minimum temperature they can be operated in.

    Contrary to Grassfarmer's explanation, the pool price is exactly what it sounds like. The sum of all the bids that are being called for at that time, divided by the total supply, and all generators get that same pooled price for that period of time. Regardless if they bid $0 or $999.99 they get paid the same. So I suppose you could call it collusion, when if you know that demand is at critical levels, you can bid the maximum amount, knowing everyone else will do the same(after all, the supply and demand is available for all to see on their public website). Under any other circumstance, it pays to bid low enough to not end up at the bottom of the stack, not producing anything.

    There are some broken links to historical generation reports on their website, they are looking into it.
    Thank you for checking it out. It doesn't show my queries to be off base. Zero output shown isn't necessarily zero output it may be #3 "Bidding too high, relative to the competition...."
    Good to see at least they are averaging the pool price now rather than awarding all them the highest price bid as they did at one time until exposed by Joe Anglin.

    Comment


      #3
      And so no one can accuse me of cherry picking. Since the end of the cold spell and the near record high demand, I've still been checking the generation sources a couple times a day, and I am pleased to report that until yesterday when it dropped back down to the low 300's MW (<17% of nameplate), wind had been quite consistently in the 1200 MW range, (~66% of capacity). Can't argue with the utility of a generation source that can do that, just don't try to make it 100%, and don't pretend that the cost per MW on these days is equivalent to the cost per MW when output approaches 0.
      Last edited by AlbertaFarmer5; Jan 29, 2020, 10:21.

      Comment


        #4
        Originally posted by grassfarmer View Post
        Thank you for checking it out. It doesn't show my queries to be off base. Zero output shown isn't necessarily zero output it may be #3 "Bidding too high, relative to the competition...."
        Which is what we kept trying to tell you. Wind and solar weren't being undercut by conventional sources when prices hit the ceiling, and all sources were called for regardless of what they bid. They were producing zero because the wind wasn't blowing, and either the sun wasn't shining, or the temp was too cold.

        Comment


          #5
          Originally posted by AlbertaFarmer5 View Post
          Which is what we kept trying to tell you. Wind and solar weren't being undercut by conventional sources when prices hit the ceiling, and all sources were called for regardless of what they bid. They were producing zero because the wind wasn't blowing, and either the sun wasn't shining, or the temp was too cold.
          There is no doubt when the price being payed was $999 per megawatt and all of the wind farms were still producing zero it was because there was no wind not because other sources off power were cheaper and wind was being underbid. Thanks for your work AB5.

          Comment


            #6
            Utilities that install intermittent renewables are well aware of their intermittent production.

            They obviously plan to have enough capacity from other sources to ensure a continued supply.

            In order to assess the capacity of renewables you need to look at year long production and look at several years to get the highs and lows. Wind turbines are only installed after a wind resource study.

            Since we already have jurisdictions in NA, Europe and Asia getting significant amounts of electricity from renewables its safe to assume that utilities know what they are doing.

            There are lots of factors that affect retail electricity prices in every jusrisdiction. Renewables will be only one of the factors.

            So the assumption that only renewables are driving up the cost of electricity or that renewables are soley responsible for high prices is speculation at best.
            Last edited by chuckChuck; Jan 29, 2020, 08:34.

            Comment


              #7
              [QUOTE=chuckChuck;439377]Utilities that install intermittent renewables are well aware of their intermittent production.

              They obviously plan to have enough capacity from other sources to ensure a continued supply.

              Chuck you have quoted articles many times about how cheap renewables are but as you have just stated above that utilities have to have enough capacity from other sources to ensure continued supply. So what I am curious about as I have asked before and never recieved an answer is which is really better for the environment: a 1000 MW solar farm backed up by a 1000 MW wind farm back up by a 1000 MW natural gas generation facility or a 1000 MW natural gas facility? Keep in mind that the solar and wind farm require extra power lines and do take land out of production. Related to this point my wife pointed out an add looking for land just east of me in the Stettler area. They wanted to lease anywhere from 320 to 2000 acres for 20 years for a potential solar farm. They were offering $175-200 per acre per year for 20 years.

              Comment


                #8
                Originally posted by chuckChuck View Post
                Utilities that install intermittent renewables are well aware of their intermittent production.

                They obviously plan to have enough capacity from other sources to ensure a continued supply.

                In order to assess the capacity of renewables you need to look at year long production and look at several years to get the highs and lows. Wind turbines are only installed after a wind resource study.

                Since we already have jurisdictions in NA, Europe and Asia getting significant amounts of electricity from renewables its safe to assume that utilities know what they are doing.

                There are lots of factors that affect retail electricity prices in every jusrisdiction. Renewables will be only one of the factors.

                So the assumption that only renewables are driving up the cost of electricity or that renewables are soley responsible for high prices is speculation at best.
                So having renewable energy and a backup doesn't increase costs. Who da thunk. FFS.

                Comment


                  #9
                  AlbertaFarmer5, other great question to ask AESO is:
                  1) how many tonnes of concrete is used to build a base for these enormous bird choppers.
                  2) will the GHG/carbon footprint for the concrete ever be recaptured in the lifetime of the windmill?
                  3) same question for steel and carbon fibre in the other windmill parts

                  **I have read in Ontario for a 512’ windmill they require 800 tonnes of concrete per base. The GHG to build the base alone will not be made up throughout the lifetime of the windmill.**

                  Once you start asking questions it might get scary.....

                  Comment


                    #10
                    Originally posted by Hamloc View Post
                    Related to this point my wife pointed out an add looking for land just east of me in the Stettler area. They wanted to lease anywhere from 320 to 2000 acres for 20 years for a potential solar farm. They were offering $175-200 per acre per year for 20 years.
                    Strange how the food vs fuel debate only applies to ethanol, but nevere hear it in regards to these type of projects.

                    Comment


                      #11
                      Lets spread the myth that what goes into a windmill in terms of energy for construction and materials is less than the the lifetime output. This has been shown to be an absolute lie.

                      No one on Agriville has the actual numbers that any utility has in their business plan for integrating renewables into their grid and the impact on electricity prices because it is unique to their grid.

                      So any claims about increased costs are unknown. And generation source makes up only a portion of grid electricity costs.

                      Its clear that cleaner renewables are being integrated to lower carbon emissions and electricity prices may increase, but we don't know by how much.

                      There is also a cost to rebuilding coal with CCS and building new hydro, nuclear, and gas plants with CCS along with the rest of the grid infrastructure.

                      There is not much point discussing unknown costs with the flat earth society who deny the science of human caused climate change and are not the least bit interested in doing anything about it and will use any flimsy argument to justify their position.

                      Comment


                        #12
                        Hamloc and AB5, just to draw a line under the discussion about what the AESO website figures show I will reiterate what I said along along - that information can not in itself be used as evidence of which facilities are actually producing at any point in time. AESO's #3 answer to AB5 clearly indicates that it shows only the output that is currently being used by the utility based on them winning the most recent bid process.
                        That explains what none of the posters were able to although I asked several times over the last year ie why at specific times were gas facilities, coal plants and hydro projects showing no output either?

                        You can spin it any way you like but I was correct in my assessment and you were wrong.

                        Comment


                          #13
                          Originally posted by grassfarmer View Post
                          Hamloc and AB5, just to draw a line under the discussion about what the AESO website figures show I will reiterate what I said along along - that information can not in itself be used as evidence of which facilities are actually producing at any point in time. AESO's #3 answer to AB5 clearly indicates that it shows only the output that is currently being used by the utility based on them winning the most recent bid process.
                          That explains what none of the posters were able to although I asked several times over the last year ie why at specific times were gas facilities, coal plants and hydro projects showing no output either?

                          You can spin it any way you like but I was correct in my assessment and you were wrong.
                          Grassfarmer your logic truly escapes me and your belief that you are correct is undoubtably wrong. As I pointed out before if you do 2 minutes of googling you will find that Sundance #3 and #5 have been mothballed until 2021. If you look today on a decidedly windy day in Alberta the wind farms are producing over 1300 MW and only 7 of the 26 simple cycle gas plants are producing power. As you recall I quoted from the website of one of the simple cycle gas generation plants websites that said it was designed to produce power on demand during times of high demand. Your refusal to admit that there are times when windmills do not produce electricity due to the weather shows that your ideology overrules your ability to analyze the numbers put in front of you. Using your logic the AESO is buying wind power today but two weeks ago it was not. What has changed to make wind power more desirable to buy today than natural gas? I would say the fact that it exists today, two weeks ago there was no wind generated power to buy. You inability to comprehend this is beyond my comprehension!!

                          Comment


                            #14
                            Originally posted by Oliver88 View Post
                            AlbertaFarmer5, other great question to ask AESO is:
                            1) how many tonnes of concrete is used to build a base for these enormous bird choppers.
                            2) will the GHG/carbon footprint for the concrete ever be recaptured in the lifetime of the windmill?
                            3) same question for steel and carbon fibre in the other windmill parts

                            **I have read in Ontario for a 512’ windmill they require 800 tonnes of concrete per base. The GHG to build the base alone will not be made up throughout the lifetime of the windmill.**

                            Once you start asking questions it might get scary.....
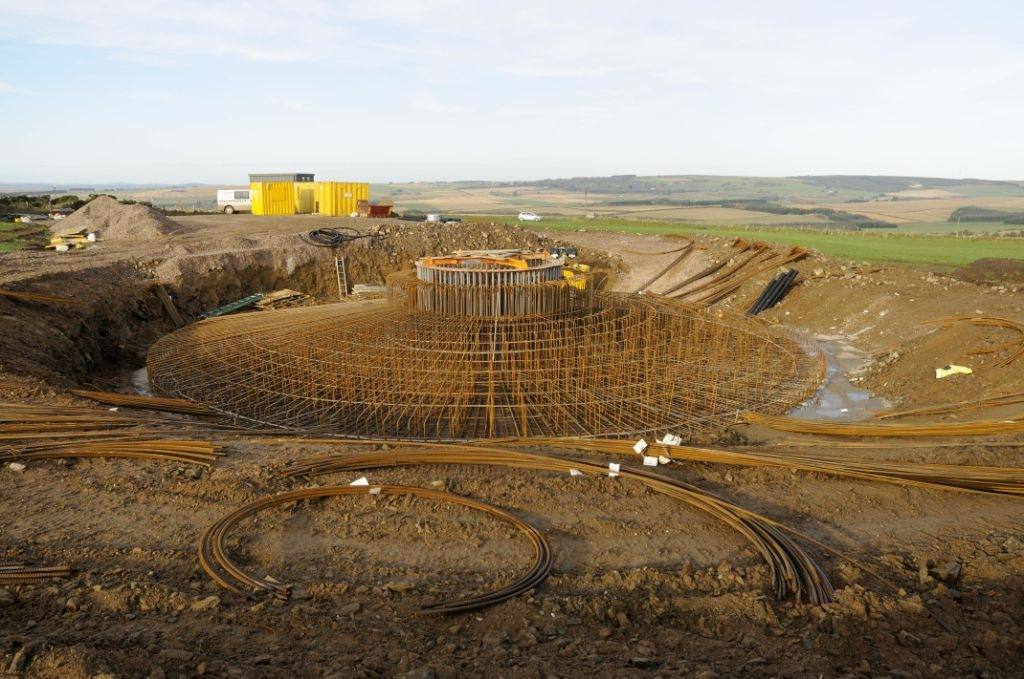
                            The total GHG used for rebar, aggregate, concrete, diesel fuel involved in the construction of the base would be good to have totalled up. This farce keeps getting crazier.


                            This picture shows a base for a 100m windmill, notice all the required rebar!!

                            Comment


                              #15
                              https://www.inderscienceonline.com/doi/full/10.1504/IJSM.2014.062496 https://www.inderscienceonline.com/doi/full/10.1504/IJSM.2014.062496

                              Comparative life cycle assessment of 2.0 MW wind turbines
                              Karl R. Haapala
                              School of Mechanical, Industrial and Manufacturing Engineering, Oregon State University, 204 Rogers Hall, Corvallis, OR, 97331, USA
                              , Preedanood Prempreeda Related information
                              Abstract

                              Wind turbines produce energy with virtually no emissions, however, there are environmental impacts associated with their manufacture, installation, and end of life. The work presented examines life cycle environmental impacts of two 2.0 MW wind turbines. Manufacturing, transport, installation, maintenance, and end of life have been considered for both models and are compared using the ReCiPe 2008 impact assessment method. In addition, energy payback analysis was conducted based on the cumulative energy demand and the energy produced by the wind turbines over 20 years. Life cycle assessment revealed that environmental impacts are concentrated in the manufacturing stage, which accounts for 78% of impacts. The energy payback period for the two turbine models are found to be 5.2 and 6.4 months, respectively. Based on the assumptions made, the results of this study can be used to conduct an environmental analysis of a representative wind park to be located in the US Pacific Northwest.

                              Wind turbine manufacturer Vestas claims that initial energy "payback" is within about 7–9 months of operation for a 1.65-2.0MW wind turbine under low wind conditions,[27][28] whereas Siemens Wind Power calculates 5–10 months depending on circumstances.[29]

                              Comment

                              • Reply to this Thread
                              • Return to Topic List
                              Working...