• You will need to login or register before you can post a message. If you already have an Agriville account login by clicking the login icon on the top right corner of the page. If you are a new user you will need to Register.

Announcement

Collapse
No announcement yet.

Oh....oh!!!!!!!

Collapse
X
Collapse
 
  • Filter
  • Time
  • Show
Clear All
new posts

    #13
    Originally posted by chuckChuck View Post
    https://www.ncdc.noaa.gov/snow-and-ice/extent/sea-ice/N/12 https://www.ncdc.noaa.gov/snow-and-ice/extent/sea-ice/N/12
    Bullshit

    Click image for larger version

Name:	ice.jpg
Views:	1
Size:	80.4 KB
ID:	769386

    Comment


      #14
      Originally posted by chuckChuck View Post
      https://www.ncdc.noaa.gov/snow-and-ice/extent/sea-ice/N/12 https://www.ncdc.noaa.gov/snow-and-ice/extent/sea-ice/N/12
      [ATTACH]5595[/ATTACH]
      Show us a chart that goes back 10000 years or even 1000 years.

      Comment


        #15
        So Jazz you have one months data January 2020 compared to 40 years of data from NOAA for Decembers that shows a clear trend line lower and you are claiming NOAA's data is bullshit! LMAO

        Your Jan 27 map also shows that as of this date, ice extent is still below the 1981 -2010 median.

        So how does this equate to bullshit? You don't even seem to know what you are looking at let alone how to use it to form an argument!

        Another example of flat earth logic?
        Last edited by chuckChuck; Feb 13, 2020, 09:27.

        Comment


          #16
          The graph shown in this this thread would be the equivalent of a second in time of eternity....

          50 year graph over even a 10000 year time period......you can't take that seriously....

          Comment


            #17
            Originally posted by chuckChuck View Post
            https://www.ncdc.noaa.gov/snow-and-ice/extent/sea-ice/N/12 https://www.ncdc.noaa.gov/snow-and-ice/extent/sea-ice/N/12
            [ATTACH]5595[/ATTACH]
            Yup , now let’s look at the rest of the story .... not just a snap shot of history . Long term data ....


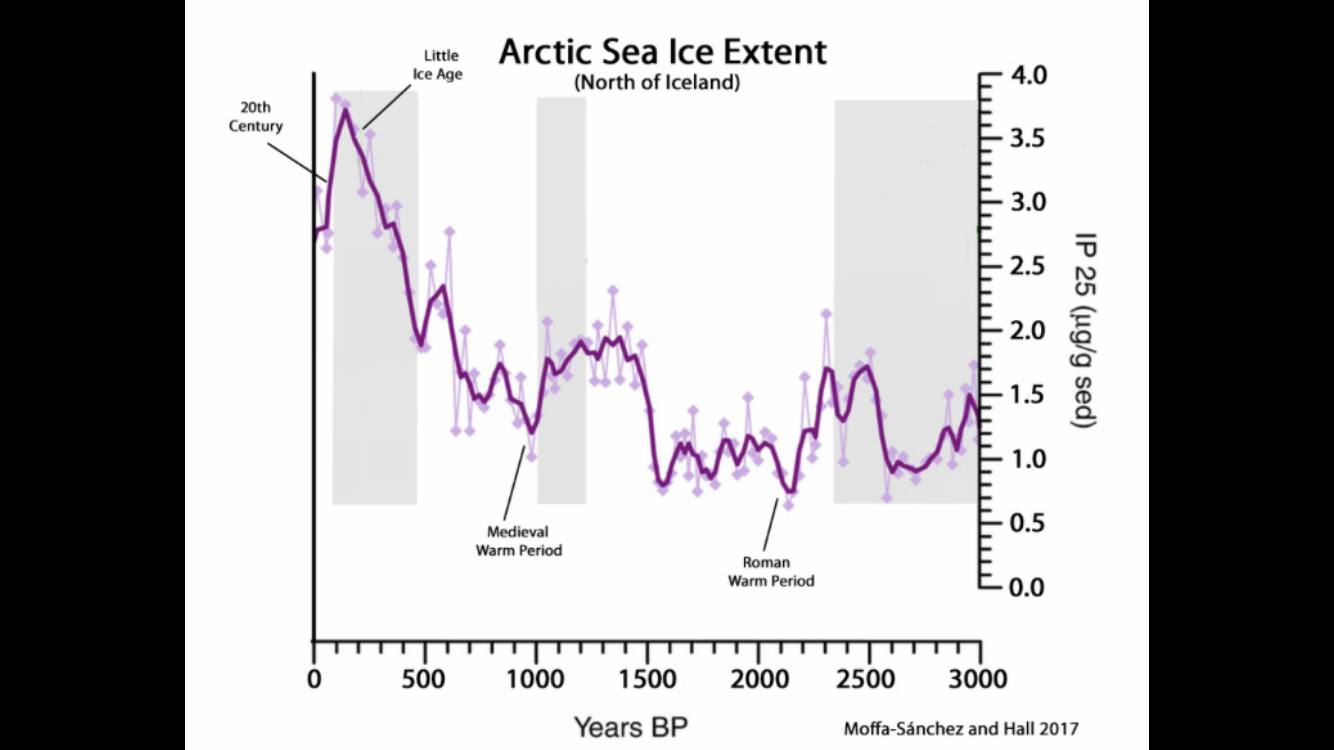
            So yup, chuck ice in general has decreased since the last major sunspot minimum, but still historically high over the past 3000 years .

            Comment


              #18
              Your graph shows a large drop in sea ice extent in the 20th century which fits with the current scientific evidence that human caused climate change is occurring.

              Comment


                #19
                Originally posted by chuckChuck View Post
                Your graph shows a large drop in sea ice extent in the 20th century which fits with the current scientific evidence that human caused climate change is occurring.
                You know chuck trying to save a guy from embarrassing himself is fruitless. You have lost so many arguments on climate change its not even funny. A rational person would reevaluate themselves with a long walk in the snow that's supposed to be gone by now.

                First loss, wildly inaccurate modally resembling nothing in reality. Second loss, 20 years of stagnate temperature and your 3rd loss is coming up when you find out one way or another, the earth is actually cooling in the past 5 years.

                Comment


                  #20
                  Another example of flat earth logic? LMAO

                  Comment


                    #21
                    Anyone else notice the daily propaganda put out by CBC? They are sure working hard to prove the need for a carbon tax. Comments are ridiculous. In one article, a commenter said farmers are carbon tax exempt! I mean how closely does some torontonian watch the weather? They never had winter in the first place, just a month of cooler than fall temps. Meanwhile we freeze out here trying to feed those types!

                    The public just doesn’t know the truth. Surely I can’t be the only one on here setting the record straight? We need to actively share the truth with people who may be swayed by it. Help a guy out?
                    Last edited by Sheepwheat; Feb 13, 2020, 10:08.

                    Comment


                      #22
                      Originally posted by chuckChuck View Post
                      Your graph shows a large drop in sea ice extent in the 20th century which fits with the current scientific evidence that human caused climate change is occurring.
                      Or does it show a natural reduction from the last major solar minimum that caused the little ice age ....

                      Comment


                        #23
                        Originally posted by chuckChuck View Post
                        Another example of flat earth logic? LMAO
                        So back to unreason and irrationality for you eh? Your bed.

                        But soon the evidence will be overwhelming and undeniable.

                        Comment


                          #24
                          If chuck actually did some obervations he would know that ice isnt like rock. its not some hard monolith that never changes. it ebbs and flows, it melts and reforms, it moves with currents and winds, it even rides over top of each other, larger flows crush smaller ones, ride over them. And the seas ice extents are bordering agains warm Atlantic and pacific currents that ebb and flow as well and the jet stream doing the same.

                          Its not supposed to be stagnate.

                          Comment

                          • Reply to this Thread
                          • Return to Topic List
                          Working...