Actually, Chuck is right about the warmest year/month/season ever constantly occuring.
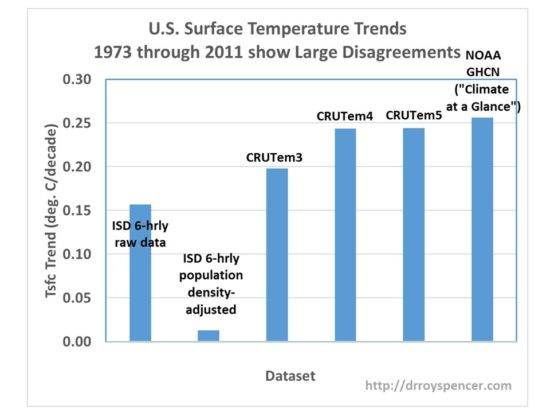
A few days ago I posted a graph showing the cumulative official temperature data adjustments to the GISS,( from NASA), All adjusted down prior to the 60's and adjusted up ever since, creating man made global warming. Add that to the Urban Heat Island effect, without which there is basically no warming trend.
https://www.drroyspencer.com/2021/01/could-recent-u-s-warming-trends-be-largely-spurious/ https://www.drroyspencer.com/2021/01/could-recent-u-s-warming-trends-be-largely-spurious/

So, Chuck is correct, the official adjusted data, skewed by urbanization absolutely shows warming, unless of course you happen to live in the real world, where the Thames river just froze for the first time in 60 years, in spite of 60 years of global warming.
A few days ago I posted a graph showing the cumulative official temperature data adjustments to the GISS,( from NASA), All adjusted down prior to the 60's and adjusted up ever since, creating man made global warming. Add that to the Urban Heat Island effect, without which there is basically no warming trend.
https://www.drroyspencer.com/2021/01/could-recent-u-s-warming-trends-be-largely-spurious/ https://www.drroyspencer.com/2021/01/could-recent-u-s-warming-trends-be-largely-spurious/

So, Chuck is correct, the official adjusted data, skewed by urbanization absolutely shows warming, unless of course you happen to live in the real world, where the Thames river just froze for the first time in 60 years, in spite of 60 years of global warming.
Comment