Announcement
Collapse
No announcement yet.
Where's the Warming chuck?
Collapse
Logging in...
Welcome to Agriville! You need to login to post messages in the Agriville chat forums. Please login below.
X
-
-
Comment
-
Can anyone suggest any plausible reason why the maps show the climate warmed for the 4 first time periods, then cooled for the next 3, then switched back to warming for the next 3? Last I checked, CO2 didn't follow such a cyclical pattern, only a relentless climb.
Given that pattern, and complete lack of corellation, any guesses what the next few maps will look like?
Assuming the unadjusted temperatures were to be used.Last edited by AlbertaFarmer5; Jun 20, 2021, 09:58.
Comment
-
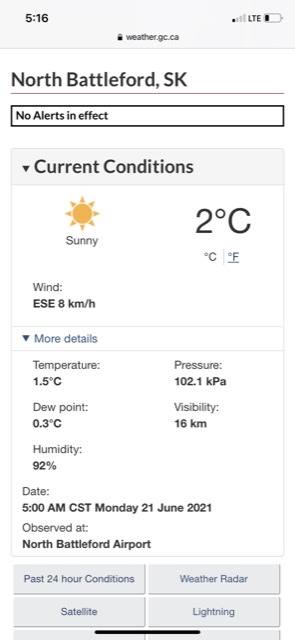
Frost advisory for Melfort Tisdale area tonight.
Yes yes I know it is just weather! But why is it always cold that is weather?
Comment
-
Not to mention what logic divides 120 years into ten 30 year periods? I would say agenda driven propaganda logic.Originally posted by AlbertaFarmer5 View PostCan anyone suggest any plausible reason why the maps show the climate warmed for the 4 first time periods, then cooled for the next 3, then switched back to warming for the next 3? Last I checked, CO2 didn't follow such a cyclical pattern, only a relentless climb.
Given that pattern, and complete lack of corellation, any guesses what the next few maps will look like?
Assuming the unadjusted temperatures were to be used.
Comment
-
Also, not to mention that the unadjusted temperature records from areas not subject to Urban Heat Island effect ( UHI), still show the 1930's being warmer than today. Somehow Chuck's maps missed that small detail.Originally posted by Happytrails View PostNot to mention what logic divides 120 years into ten 30 year periods? I would say agenda driven propaganda logic.
Comment
-
-
- Reply to this Thread
- Return to Topic List


Comment