• You will need to login or register before you can post a message. If you already have an Agriville account login by clicking the login icon on the top right corner of the page. If you are a new user you will need to Register.

Announcement

Collapse
No announcement yet.

Alberta Climate Records

Collapse
X
Collapse
 
  • Filter
  • Time
  • Show
Clear All
new posts

    #46
    Originally posted by chuckChuck View Post
    Take a look at the map and you will see that every county can be looked at. So that includes the majority of non urban and largely rural communities where urban development would have almost no impact. The ones I referred to were the general area south and east of Lethbridge and no where near the city.
    That is not at all what the map is showing. The map is divided into roughly 6 by 6 mile grids. Do you seriously think that there is a weather station in the center of each of those?

    There are weather stations near most larger urban areas, and a very occasional rural station throughout the province, and those records are extrapolated out to the surrounding rural areas. Contaminating all of the rural squares with the urban heat island effect. In my case, the nearest stations are 25 miles NW, and 25 miles South. In recent decades there have been no active stations inbetween. Any claimed granularity on the level the map indicates is entirely man made, not based on actual data.

    And as noted above, even those existing stations have so many holes and gaps in the data that even those data sets have massive infilling and extrapolating from stations much further away.
    Last edited by AlbertaFarmer5; Nov 3, 2021, 09:38.

    Comment


      #47
      Originally posted by Blaithin View Post
      I was just browsing some rainfall data this morning.

      AFAWK all these locations are at the towns airports. They shouldn’t be very far away from each other to explain some freak thunderstorm (because there was lots of those this year…) causing the differences. Also it’s always the EC sites that seem to be far and away drier than the AFSC ones over the summer.


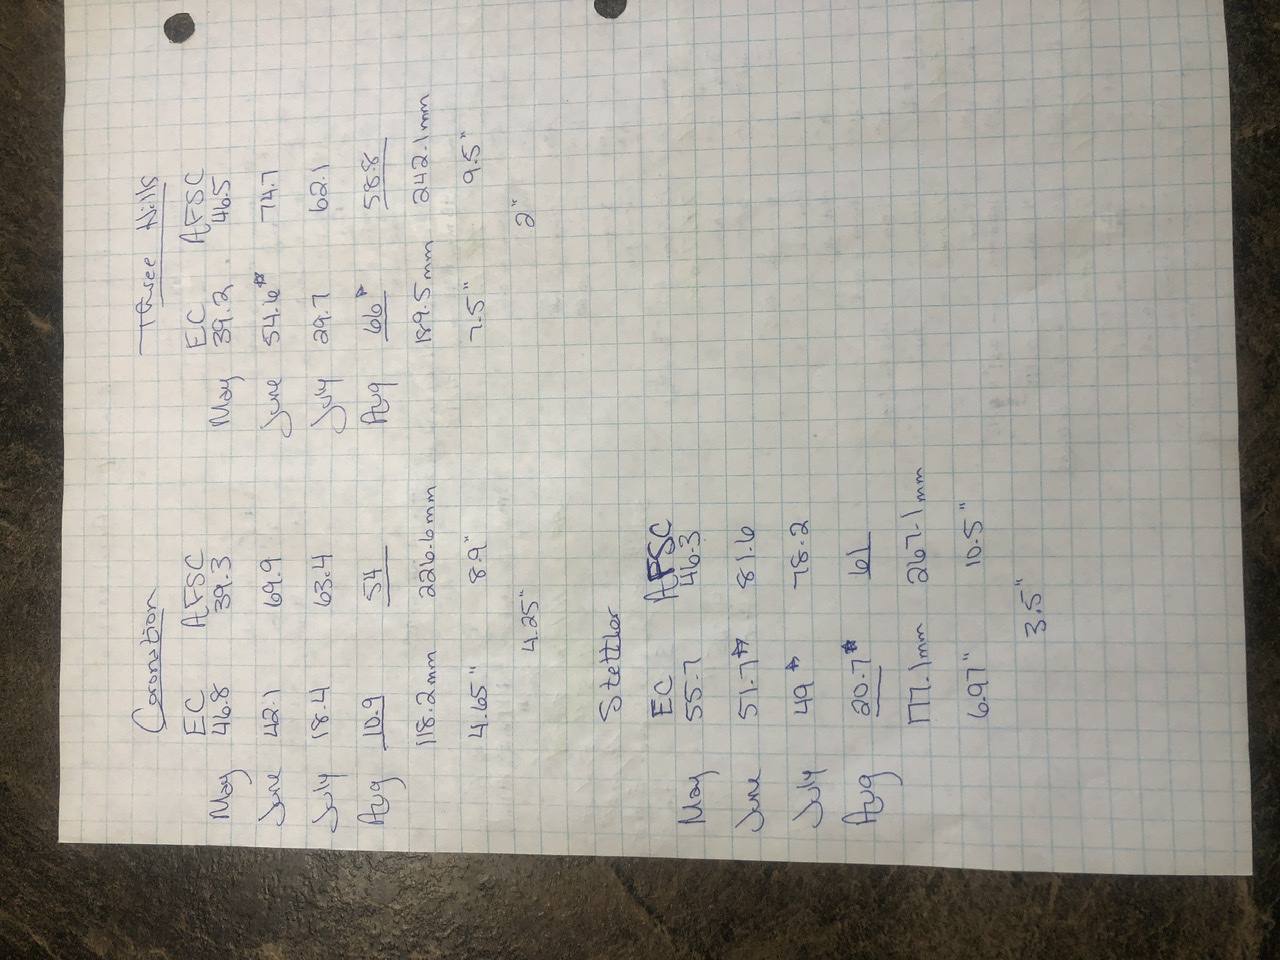
      Also had an independent comparison with an AFSC station and the farms rain gauge, less than a quarter mile away. 4.25” difference. Absolutely no way a storm hit the AFSC site and didn’t touch the farm. So….

      How does one decide which data is correct?
      And coincidentally, AFSC's rainfall records, which just so happen to be higher than anyone else's, are the ones used to calculate rainfall for lack of moisture insurance. And miraculously, every year seems to be above average. Kind of like the global warmists claims that everywhere is warming twice as fast as everywhere else.

      Comment


        #48
        Originally posted by AlbertaFarmer5 View Post
        That is not at all what the map is showing. The map is divided into roughly 12 by 12 mile grids. Do you seriously think that there is a weather station in the center of each of those?

        There are weather stations near most larger urban areas, and a very occasional rural station throughout the province, and those records are extrapolated out to the surrounding rural areas. Contaminating all of the rural squares with the urban heat island effect. In my case, the nearest stations are 25 miles NW, and 25 miles South. In recent decades there have been no active stations inbetween. Any claimed granularity on the level the map indicates is entirely man made, not based on actual data.

        And as noted above, even those existing stations have so many holes and gaps in the data that even those data sets have massive infilling and extrapolating from stations much further away.
        Whoa there A5.

        Are you saying all the data for the entire province on the Alberta Climate Records are "contaminated" by the urban heat island effect? Seriously?

        That is quite the claim to put it mildly. So how do you know that? Show us your math.

        You don't think that climate scientists are well aware of the heat island impact and take account of this in their research and analysis?

        Here is an explanation

        "Scientists have been very careful to ensure that UHI is not influencing the temperature trends. To address this concern, they have compared the data from remote stations (sites that are nowhere near human activity) to more urban sites. Likewise, investigators have also looked at sites across rural and urban China, which has experienced rapid growth in urbanisation over the past 30 years and is therefore very likely to show UHI. The difference between ideal rural sites compared to urban sites in temperature trends has been very small:"

        So any suggestion that urban heat islands are driving regional, provincial or national climate change is not accurate.

        Of course urban heat islands do drive urban temperatures much higher.

        Last June and July 595 people, mostly seniors died in British Columbia's record heat wave.

        This is profound evidence of the very negative impacts of climate change.
        Last edited by chuckChuck; Nov 2, 2021, 07:45.

        Comment


          #49
          Originally posted by AlbertaFarmer5 View Post
          That is not at all what the map is showing. The map is divided into roughly 12 by 12 mile grids. Do you seriously think that there is a weather station in the center of each of those?

          There are weather stations near most larger urban areas, and a very occasional rural station throughout the province, and those records are extrapolated out to the surrounding rural areas. Contaminating all of the rural squares with the urban heat island effect. In my case, the nearest stations are 25 miles NW, and 25 miles South. In recent decades there have been no active stations inbetween. Any claimed granularity on the level the map indicates is entirely man made, not based on actual data.

          And as noted above, even those existing stations have so many holes and gaps in the data that even those data sets have massive infilling and extrapolating from stations much further away.
          There are over 400 provincially and federally run weather stations in Alberta.

          Here is the site where you can find the 400 plus weather stations. https://www.alberta.ca/acis-find-current-weather-data.aspx

          So have you taken the time to look at their locations before making that sweeping statement that they are all contaminated by the urban heat island effect?

          If you are really concerned about the Alberta Climate Records data and maps why not ask the scientists involved about how they put the data, analysis and maps together before coming to your sweeping generalizations?

          Comment


            #50
            You seem to believe all "Climate Scientists" are equally competent and everything published on CBC is unquestionable.

            When an agricultural scientist hired by a seed company comes selling you Canola do you consider thier published material and opinions all of equal value?

            I consider the largest part of material from both examples to have little or no value until I can see some long term conformation of thier results.

            Is that a fair statement to you Chuck?

            Comment


              #51
              Chuck, you completely missed the point as usual.

              You made the ridiculous statement that you had picked a point in a rural area, therefore it was representative of the rural area, and not any urban area.

              What I am pointing out, is that there are almost no rural stations, at least not in the last few decades. So any square you pick on the map outside of an urban area, is just a blend of the nearest urban areas.
              There is no data for the random square you picked. Just infilled from the nearest stations.

              And if you bother to check the actual data, you will discover that much of the data from the existing urban stations is completely missing and had to be infilled from somewhere else, or guessed. Most of this map is a guess based on a guess based on a guess from somewhere far away. Cherry picked to not include all of the warm period prior to the 50's, and so far, not updated to show the cooling trend and shorter growing season going on now.

              And as Blaithin pointed out, there are major discrepancies between the EC and the AFSC precipitation totals in the modern instrument era. Now we are supposed to believe that the data from 70 years ago, using the technology of today is fit for purpose, when todays data clearly is not. When the difference between the sets of two stations Blaithin posted are far far larger than any detectable trend over 70 years, what does that tell you about the reliability of that trend?
              Last edited by AlbertaFarmer5; Nov 2, 2021, 10:13.

              Comment


                #52
                Originally posted by chuckChuck View Post
                Whoa there A5.

                Are you saying all the data for the entire province on the Alberta Climate Records are "contaminated" by the urban heat island effect? Seriously?

                That is quite the claim to put it mildly. So how do you know that? Show us your math.

                You don't think that climate scientists are well aware of the heat island impact and take account of this in their research and analysis?

                Here is an explanation

                "Scientists have been very careful to ensure that UHI is not influencing the temperature trends. To address this concern, they have compared the data from remote stations (sites that are nowhere near human activity) to more urban sites. Likewise, investigators have also looked at sites across rural and urban China, which has experienced rapid growth in urbanisation over the past 30 years and is therefore very likely to show UHI. The difference between ideal rural sites compared to urban sites in temperature trends has been very small:"

                So any suggestion that urban heat islands are driving regional, provincial or national climate change is not accurate.

                Of course urban heat islands do drive urban temperatures much higher.

                Last June and July 595 people, mostly seniors died in British Columbia's record heat wave.

                This is profound evidence of the very negative impacts of climate change.
                Everywhere is warming twice as fast as everywhere else

                Comment


                  #53
                  Originally posted by caseih View Post
                  Everywhere is warming twice as fast as everywhere else

                  Comment


                    #54
                    Originally posted by AlbertaFarmer5 View Post
                    Chuck, you completely missed the point as usual.

                    You made the ridiculous statement that you had picked a point in a rural area, therefore it was representative of the rural area, and not any urban area.

                    What I am pointing out, is that there are almost no rural stations, at least not in the last few decades. So any square you pick on the map outside of an urban area, is just a blend of the nearest urban areas.
                    There is no data for the random square you picked. Just infilled from the nearest stations.

                    And if you bother to check the actual data, you will discover that much of that is completely missing and had to be infilled from somewhere else, or guessed.

                    And as Blaithin pointed out, there are major discrepancies between the EC and the AFSC precipitation totals in the modern instrument era. Now we are supposed to believe that the data from 70 years ago, using the technology of today is fit for purpose, when todays data clearly is not. When the difference between the sets of two stations Blaithin posted are far far larger than any detectable trend over 70 years, what does that tell you about the reliability of that trend?
                    Look at the map you can choose any location you want based on the nearest data collection site whether suburban or rural. Unless you know how the map was created, you are only speculating about its content and accuracy.

                    "there are almost no rural weather stations"! Huh?

                    Look at the screen shot of weather stations below and tell us again there are not many rural stations! LOL

                    How many are "contaminated" with the urban heat island effect? Are you going to guess again? It doesn't look like many considering the number of stations in rural Alberta!

                    Again you are making a lot of assumptions and generalized statements without confirmation of what data and stations across Alberta were included.

                    Unless you have a very detailed description of the data sources, methods and analysis that went into the Alberta Climate Records,how can you be so sure of your opinions?

                    You should at least discuss your concerns with the scientists involved in setting up the website. Otherwise you may be very far off the mark in your criticism.

                    Click image for larger version

Name:	Screenshot 2021-11-02 at 10-22-33 Current and Historical Alberta Weather Station Data Viewer.jpg
Views:	1
Size:	18.3 KB
ID:	771954
                    Last edited by chuckChuck; Nov 2, 2021, 10:40.

                    Comment


                      #55
                      I checked the number of EC weather stations throughout the period in question. Started out in 1951 with 146 stations in Alberta, and ended up with 285 in 2017 ( down to 273 as of 2021).
                      There were more stations at times in the intervening years, but this means that at the very most, there are 146 stations with continuous records. Except I randomly compared the stations starting with B, there is almost no overlap over this time period. Of the 29 "B" stations in 2021, There are 4 stations starting with B in 2021 that also existed in 1951. There were 11 B stations in 1951, 7 have disappeared. replaced by 25 new B stations. So only 4 out of 11 of those stations could potentially have a continuous record up to 2017. I didn't check if those have continuous records, but based on my previous searches, I would guess none of them do.

                      So Roughly 1/3 of the 146 stations existing in 1951 could potentially be useful for creating the map. Call it 50 stations. But worse yet, they aren't evenly distributed. For example, there are 11 stations with the word Edmonton in ther name. There is 255,500 sq miles in AB.
                      That works out to 7097 of 6 by 6 mile squares on the map Chuck posted. So each station with a potentially continuous record represents more than 142 squares on average. Except the stations are not evenly distributed.

                      So the odds of the square Chuck used in his example having actual data to back up the numbers is 0.7%.
                      And even if he chose a square that actually had a continuous station, much of the missing data was still infilled from nearby stations, since there are massive gaps in every record I have checked.
                      Last edited by AlbertaFarmer5; Nov 3, 2021, 09:37.

                      Comment


                        #56
                        And even better yet, this map portends to predict the future climate 40 years out.

                        So not only do we not know the current conditions, as evidenced by the stark disagreement between side by side weather stations in Blaithin's example, or the various climate data sets currently in use, which have drastic disagreement on current temperature let alone all other metrics.

                        We don't know the past trends to anywhere near the accuracy or granularity the map pretends to indicate, as I have been pointing out. And it only gets worse the further back you go, the further from the populated first world you go, and the further out or down into the oceans, in up into the atmosphere you go.

                        We don't have the slightest clue what the climate sensitivity ( Charney) to a doubling of CO2 is, as we have discussed in multiple threads already.

                        We don't even know within orders of magnitiude how long the CO2 will remain in the atmosphere. See previous threads of this topic.

                        But when we plug all those unknowns into a model, it makes a pretty map that indicates it is worse than we thought, and gets the sky is falling crowd all excited. So excited, that he posted it again a few years later, pretending that it is new news all over again.

                        And this is the quality of analysis that we are basing energy policy on.

                        Comment


                          #57
                          No surprises from A5 when it comes to assessing the work of climatologists. Basically summed up he doesn't trust their numbers or analysis. There all wrong!

                          It's the predictable fodder of climate change denial and skeptics.

                          A5 If you want your questions on the accuracy of the maps or data that is used you could contact the scientists at the University of Lethbridge involved and ask the questions about the data, the number of continuous reporting stations, their distribution, data analysis and how the map was developed. Let us know what you find out.

                          But so far, all we get is your opinion, that based on Blaithin's one example of a discrepancy between weather stations they must all be suspect? Huh?

                          Your first attempt to discredit the data was to suggest the temperature data all across rural Alberta was/is subject to urban heat island influence. That attempt to discredit fell flat too.

                          Then you question the number and historical distribution of stations, without a clue how the data was assembled accounting for missing data or changing station data sources.

                          In all cases that's not science, that's speculation and opinion.

                          Regardless, policy makers at all levels are listening to the bonafide climate researchers and not amateurs on social media when it comes to making policy.
                          Last edited by chuckChuck; Nov 3, 2021, 10:13.

                          Comment


                            #58
                            Perhaps you should read before you respond..
                            First off, the researchers from the u of Lethbridge who made the maps did not compile the data if you read there the website, their source is data already compiled / created by environment Canada.
                            How about you help me out here please. Of the approximately 50 stations that may have continuous records, can you check environment Canada's weather records and tell us how many of those are rural, and how many are Urban? Based on the fact that there are 11 stations named Edmonton in the 2017 records, I'm guessing you won't find very many that aren't urban. The data from those few existing stations is being extrapolated out to cover the entire province. The urban heat island is inevitably being spread across all areas without stations. Because that is all we have to go by.

                            Comment


                              #59
                              A5, If you say so.

                              You seem like you will never change your mind regardless of the science or evidence.

                              You still stuck on the heat island influence?

                              You don't think that climate scientists are well aware of the heat island impact and take account of this in their research and analysis?

                              Here is an explanation

                              "Scientists have been very careful to ensure that UHI is not influencing the temperature trends. To address this concern, they have compared the data from remote stations (sites that are nowhere near human activity) to more urban sites. Likewise, investigators have also looked at sites across rural and urban China, which has experienced rapid growth in urbanisation over the past 30 years and is therefore very likely to show UHI. The difference between ideal rural sites compared to urban sites in temperature trends has been very small:"
                              Last edited by chuckChuck; Nov 3, 2021, 10:25.

                              Comment


                                #60
                                I consider 1.5 degrees as very small.

                                I'm not a climate change denier Chuck. I believe the climate has shown some significant changes in my lifetime.
                                South of Saskatoon used to be all 1/2 summerfallow. Guys that tried more were ridiculed due to predictably poor results.
                                The climate is always changing. Always has always will.
                                But you can't buy a thermostat to dial to what you think you want.
                                Will never happen but we won't know because they will just keep increasing climate taxes with no results long after we are gone.

                                Comment

                                • Reply to this Thread
                                • Return to Topic List
                                Working...