Originally posted by Taiga
View Post
Announcement
Collapse
No announcement yet.
Friday Crop Report on a Thursday!
Collapse
Logging in...
Welcome to Agriville! You need to login to post messages in the Agriville chat forums. Please login below.
X
-
-
that ****er is going to tax 3500 duraxâ€s.
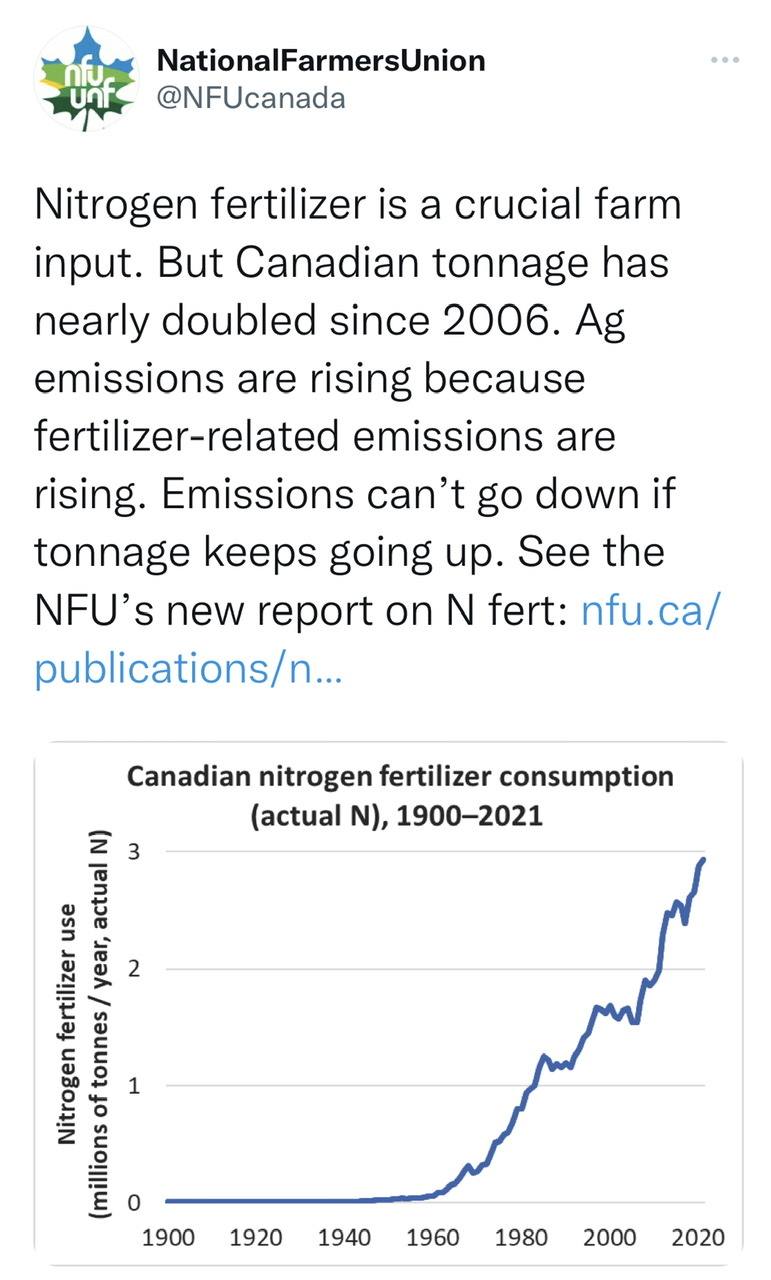
any one see this article fr om NFU

who supports these fools
1 most farms didn’t use fertilizer in the 50s
most farms were half and half.
high use one group increased production brought there soil back to almost like it was and the other bunch of organic fools wants us all to go back to shit farming
Comment
-
-
Originally posted by SASKFARMER View Postt
who supports these fools
Archived - Fertilizer shipments to Canadian agriculture markets, by nutrient content and fertilizer year
Frequency: Annual
Table: 32-10-0274-01 (formerly CANSIM 001-0065)
Release date: 2013-05-21
Fertilizer shipments to Canadian agriculture markets, by nutrient content and fertilizer year, cumulative data (x 1,000) c 1 2 3 4 5 6 7
Frequency: Annual
Table: 32-10-0039-01 (formerly CANSIM 001-0069)
Release date: 2022-08-19
These are the same table Chuck uses
(Statistics Canada Tables 32-10-0274-01 and 32-10-0039-01)
The other table Chuck quotes is from 1949 to 1977 and 1927 to 1948
Statistics Canada Tables 32-10-0274-01 and 32-10-0039-01; Maurice Korol and Gina Rattray, “Canadian Fertilizer Consumption, Shipments and Trade: 1999/2000†(Ottawa: Agriculture and Agri-Food Canada, 2001), http://www5.agr.gc.ca/resources/prod/doc/pol/pub/canfert/pdf/canfert99_00_e.pdf; Statistics Canada and Dominion Bureau of Statistics, “The Fertilizer Trade,†various years from 1926 to 1948, accessed June 29, 2022, https://publications.gc.ca/site/eng/9.853796/publication.html. 59 While acres have shifted to canola and corn from wheat, etc. Canadian wheat production tonnage continues to trend upward, is near a record high, and exceeds tonnage of either canola or corn. See Statistics Canada Table 32-10-0359-01. 60 Nutrien Ltd., “Nutrien Fact Book 2022†(Saskatoon: Nutrien, June 2022), 20,
__________________________________________________ ________________________________
Maybe he could wander over from Rural Issues and find the data from 1900 to 1927 – to create his dramatic chart
I’m sure it has been peer reviewed and no one caught the fertilize use versus shipments.
In 2006 Nitrogen SHIPMENTS were – 1,539,945 MT – in 2021/22 – they were 2,726,000 MT but see the difference in the graph with 21/22…
His chart reads USE not shipments – it is no wonder he thought there were wheat premiums until 2012.
Look at the fertilizer storage that has been built on the Prairies – both commercial and on farm since 2006 – but that wouldn’t fit their message -
Come on over Chucky… the waters fine.. but the Koolaid is long gone
Comment
-
Maybe one of the “pros†can answer this.
How can an average crop at best fill the pipeline after a disaster last yr? Please enlighten me.
Prices are collapsing every day, keep hearing the crop is getting bigger. There is problems everywhere you hear, except Canada is about to harvest a record crop. Yes, it’s higher than last yr, but there wasn’t much last yr. Please don’t use the ol “harvest pressure†excuse. That’s a crock of you know what.
These prices are going to put a lot farmers in financial trouble with well below average yields with inputs rising out of control.
It’s going to be a long winter unless things start turning around.
Comment
-
Comment
-
-
[QUOTE=BTO780;547622]Maybe one of the “pros†can answer this.
These prices are going to put a lot farmers in financial trouble with well below average yields.
/QUOTE]
Don't shoot the messenger - this is compared to 2020.
Not everyone is well below average....
and after 40 years - i still aint a pro...
Comment
- Reply to this Thread
- Return to Topic List

Comment