who here still believes the story that this mess the last two years all started because sombody in wuhan had a bowl of bat soup ? i had lots of questions right from the start , and still have
Announcement
Collapse
No announcement yet.
who here still believes the bat soup story ?
Collapse
Logging in...
Welcome to Agriville! You need to login to post messages in the Agriville chat forums. Please login below.
X
-
Originally posted by cropgrower View Posteven harder to fathom how they still have not discovered how it started 🤔Last edited by furrowtickler; Mar 2, 2022, 22:58.
Comment
-
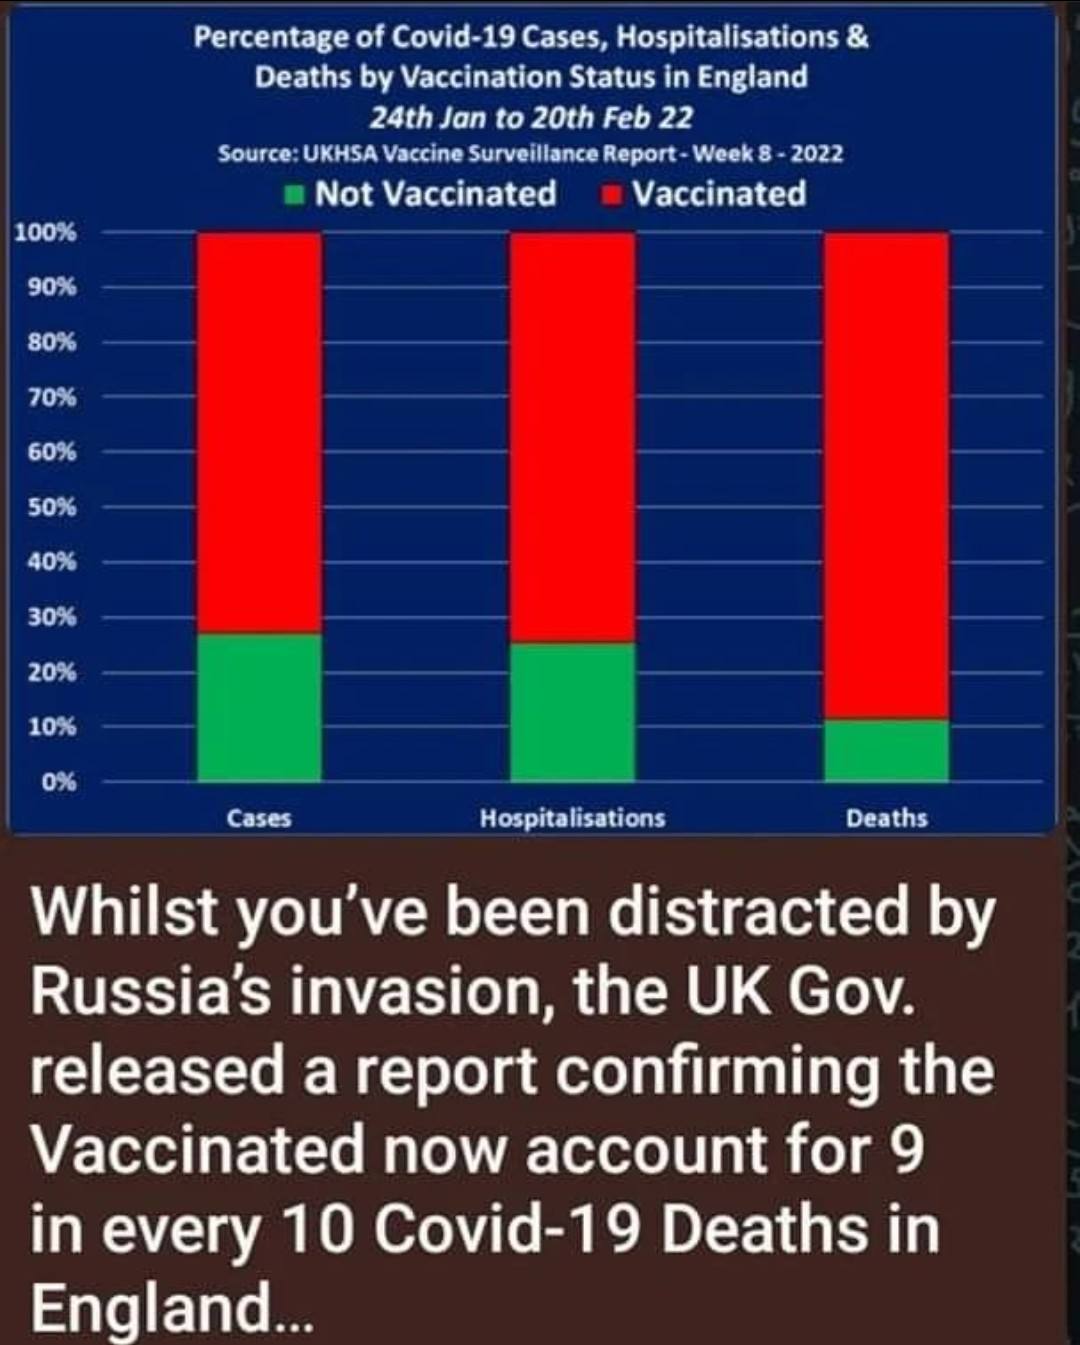
Originally posted by Jordy2323 View PostIn MB, the fully vaxxed (2 doses) account for equal/or higher cases, hospitalizations, ICU and deaths than their per capita.
So that would be some negative efficacy.
Comment
-
Originally posted by cropgrower View Postdml whats your opinion on how it all started ? if people knew the truth every choice gets a lot simpler , eg for me man made virus no 💉, natural virus mabeLast edited by dmlfarmer; Mar 3, 2022, 16:37.
Comment
-
Originally posted by dmlfarmer View PostNo, not negative efficacy, bad spin. Had you put up the next chart in the series of charts on the manitoba website it would have shown there is no negative efficacy. However, that next chart does not support your claim therefore you ignored it. So let me put it up for you.
Right there in the data.
Comment
-
Originally posted by Jordy2323 View PostThere is no spin. The double vaxxed (Fully vaxxed) have covid stats disproportionate to their population.
Right there in the data.
just like the math challenged who compare 1/3and 1/4and think since 3 is less than 4 then 1/3 must be smaller than 1/4, you are only comparing the numerators of the fractions.
In this case, in calculating the ratios and thereby the risk, the denominators are not the same for vaccination status. You have to first calculate the number of people in each group to determine the risk fractions. That is not done in the two charts provided. However you can calculate it from the charts. And if you do that you will find that cases, hospitalizations, and deaths the highest risk is 1 shot, then 0 shots, then 2 shots, and then3 shots. The one shot higher risk may be partially explained by the low number of people who only got one shot. This calculation is confirmed by the chart which you ignored, but which I posted. As well, this reflects the same findings as the CDC charts I posted.Last edited by dmlfarmer; Mar 3, 2022, 22:01.
Comment
- Reply to this Thread
- Return to Topic List
Comment